1. 元素
canvas元素
canvas是一个可以使用JS来绘制图形的HTML元素。canvas标签只有两个属性——width和height。
1
| <canvas id="tutorial" width="150" height="150"></canvas>
|
渲染上下文
canvas元素创造了一个固定大小的画布,它公开了一个或多个渲染上下文,用来绘制和处理要展示的内容。
1
2
| var canvas = document.getElementById('tutorial');
var ctx = canvas.getContext('2d');
|
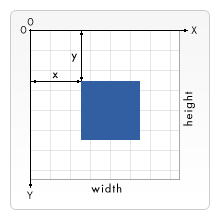
坐标
画布的起点为左上角(坐标(0, 0)),所有元素的位置都相对于原点定位。
2. 绘制
2.1 矩形
1
2
3
| ctx.fillRect(x, y, width, height) 绘制一个填充的矩形
ctx.strokeRect(x, y, width, height) 绘制一个矩形的边框
ctx.clearRect(x, y, width, height) 清除指定矩形区域,让清除部分完全透明
|
2.2 圆弧
画一个以(x,y)为圆心的radius为半径的圆,从startAngle开始到endAngle结束,按照anticlockwise给定的方向(默认顺时针)生成。
1
| ctx.arc(x, y, radius, startAngle, endAngle, anticlockwise)
|
根据给定的控制点和半径画一段圆弧,再以直线连接两个控制点。
1
| ctx.acrTo(x1, y1, x2, y2, radius)
|
2.3 路径
路径是通过不同颜色和宽度的线段/曲线相连形成的不同形状的店的集合。绘制图形的步骤:①创建路径起点;②使用画图命令画出路径;③封闭路径;④通过描边或填充路径来渲染图形。
1
2
3
4
5
6
| ctx.beginPath() 新建路径
ctx.moveTo(x,y) 将笔触移动到(x,y)上
ctx.lineTo(x,y) 绘制一条从当前位置到(x,y)的直线
ctx.closePath() 闭合路径
ctx.stroke() 绘制路径
ctx.fill() 填充路径
|
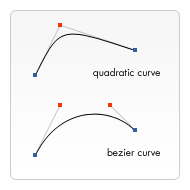
2.4 贝塞尔曲线
二次贝塞尔曲线, cplx,cply为一个控制点, x,y为结束点
1
| quadraticCurveTo(cplx, cply, x, y)
|
三次贝塞尔曲线, cplx,cply为控制点1, cp2x,cp2y为控制点2, x,y为结束点
1
| bezierCurveTo(cplx, cply, cp2x, cp2y, x, y)
|
3. 使用样式和颜色
3.1 描边,填充
1
2
3
4
5
6
7
8
9
10
11
12
| ctx.fillStyle = color 设置图形的填充颜色
ctx.strokeStyle = color 设置图形轮廓的颜色
ctx.globalAlpha = transparencyValue 设置canvas里所有图形的透明度
lineWidth = 1 设置线条宽度
lineCap = 'butt/round/square' 设置线条末端样式
lineJoin = 'round/bevel/miter' 设定线条与线条间接合处的样式
miterLimit = 1 限制两条线相交时交接处最大长度
getLineDash() 返回当前虚线样式
setLineDash([4, 2]) 设置当前虚线样式,接受一个数组来指定线段与间隙的交替
lineDashOffset = value 设置虚线样式的起始偏移量
|
3.2 渐变
我们可以用线性或径向的渐变来填充或描边。新建一个canvasGradient对象,并且赋给fillStyle或strokeStyle属性。
1
2
3
4
5
6
7
8
9
10
11
12
13
|
var lineargradient = ctx.createLinearGradient(x1, y1, x2, y2);
var radialgradient = ctx.createRadialGradient(x1, y1, r1, x2, y2, r2);
lineargradient.addColorStop(0, '#000');
lineargradient.addColorStop(1, '#fff');
ctx.fillStyle = lineargradient;
ctx.strokeStyle = lineargradient;
|
3.3 图案样式
图案的应用和渐变很像,创建出一个pattern后,赋给fillStyle或strokeStyle属性即可。
1
2
3
4
| var img = new Image();
img.src = 'someimage.png';
var ptrn = ctx.createPattern(img, type)
|
3.4 阴影
1
2
3
4
5
6
7
| ctx.shadowOffsetX = float 设定阴影在X轴的延伸距离
ctx.shadowOffsetY = float 设定阴影在Y轴的延伸距离
ctx.shadowBlur = float 设定阴影的模糊程度
ctx.shadowColor = color 设定阴影颜色
ctx.font = '123';
ctx.fillStyle = '#000';
ctx.fillText('Sample String', 5, 30);
|
4. 文本和图片
1
2
3
4
5
6
7
8
9
10
11
| ctx.font = '10px sans-serif';
ctx.textAlign = 'start/end/left/right/center';
ctx.textBaseline = 'top/hanging/middle/alphabetic/ideographic/bottom';
ctx.direction = 'ltr/rtl/inherit';
ctx.fillText(text, x, y, maxWdith) 在指定的(x,y)位置填充指定文本,绘制的最大宽度可选
ctx.strokeText(text, x, y, maxWidth) 在指定的(x,y)位置绘制指定文本,绘制的最大宽度可选
var text = ctx.measureText('foo');
text.width
|
1
2
3
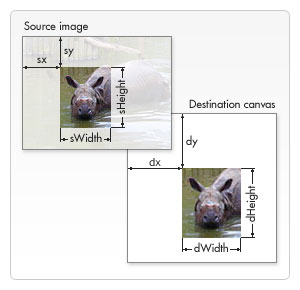
| drawImage(image, x, y) 绘制图片
drawImage(image, x, y, width, height) 绘制图片(缩放)
drawImage(image, sx, sy, sWidth, sHeight, dx, dy, dWidth, dHeight3) 切片
|
5. 变形
5.1 状态的保存和恢复
Canvas状态存储在栈中,每当save()方法被调用后,当前的状态就被推送到栈中。你可以调用任意多次save方法,每一次调用restore方法,上一个保存的状态就从栈中弹出,所有设定都恢复。
一个绘画状态包括:①当前应用的变形(移动、旋转、缩放);②strokeStyle, fillStyle, globalAlpha, lineWidth, lineCap, lineJoin, miterLimit, shadowOffsetX, shadowOffsetY, shadowBlur, shadowColor, globalCompositeOperation 的值; ③当前的裁切路径
1
2
| ctx.save() 保存canvas状态
ctx.restore() 恢复canvas状态
|
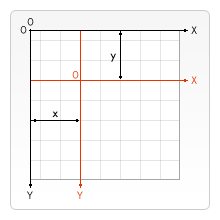
5.2 移动,旋转,变形,缩放
1
2
3
4
5
| ctx.translate(x, y) [移动]移动canvas和它的原点到一个不同的位置
ctx.rotate(angle) [旋转]以原点为中心旋转canvas
ctx.scale(x, y) [缩放]对形状,位图进行缩小或者放大,x, y默认值为1
ctx.transform(m11, m12, m21, m22, dx, dy) [变形]
ctx.transform(水平方向的缩放,水平方向的倾斜偏移,竖直方向的缩放,竖直方向的倾斜偏移,水平方向的移动,竖直方向的移动)
|
6. 其它
6.1 动画
保存canvas状态, 清空canvas, 重绘动画帧。高级动画示例
6.2 颜色选择器
像素操作: ctx.getImageData(left, top, width, height)
1
2
3
4
5
6
7
8
9
10
11
12
13
14
15
16
17
18
19
20
| var img = new Image();
img.src = 'https://mdn.mozillademos.org/files/5397/rhino.jpg';
var canvas = document.getElementById('canvas');
var ctx = canvas.getContext('2d');
img.onload = function() {
ctx.drawImage(img, 0, 0);
img.style.display = 'none';
};
var color = document.getElementById('color');
function pick(event) {
var x = event.layerX;
var y = event.layerY;
var pixel = ctx.getImageData(x, y, 1, 1);
var data = pixel.data;
var rgba = 'rgba(' + data[0] + ',' + data[1] +
',' + data[2] + ',' + (data[3] / 255) + ')';
color.style.background = rgba;
color.textContent = rgba;
}
canvas.addEventListener('mousemove', pick);
|
6.3 图片灰度和反相颜色
在场景中写入像素数据: ctx.putImageData(myImageData, dx, dy)
1
2
3
4
5
6
7
8
9
10
11
12
13
14
15
16
17
18
19
20
21
22
23
24
25
26
27
28
29
30
31
32
33
34
35
36
37
38
| var img = new Image();
img.src = 'https://mdn.mozillademos.org/files/5397/rhino.jpg';
img.onload = function() {
draw(this);
};
function draw(img) {
var canvas = document.getElementById('canvas');
var ctx = canvas.getContext('2d');
ctx.drawImage(img, 0, 0);
img.style.display = 'none';
var imageData = ctx.getImageData(0,0,canvas.width, canvas.height);
var data = imageData.data;
var invert = function() {
for (var i = 0; i < data.length; i += 4) {
data[i] = 225 - data[i];
data[i + 1] = 225 - data[i + 1];
data[i + 2] = 225 - data[i + 2];
}
ctx.putImageData(imageData, 0, 0);
};
var grayscale = function() {
for (var i = 0; i < data.length; i += 4) {
var avg = (data[i] + data[i +1] + data[i +2]) / 3;
data[i] = avg;
data[i + 1] = avg;
data[i + 2] = avg;
}
ctx.putImageData(imageData, 0, 0);
};
var invertbtn = document.getElementById('invertbtn');
invertbtn.addEventListener('click', invert);
var grayscalebtn = document.getElementById('grayscalebtn');
grayscalebtn.addEventListener('click', grayscale);
}
|
6.4 把canvas保存为图片
1
2
| canvas.toDataURL('image/png', quality) 创建一个png图片,0-1的品质量,1最好
canvas.toBlob(callback, type, encoderOptions) 创建一个画布中代表图片的Blob对象
|
6.5 websocket实现白板功能
- 绘制线条,直线,椭圆,矩形(可选择画笔粗细,线条颜色,填充颜色)
- 写字,输入框中输入确定后显示在画布上
- 橡皮檫,清空画布
- 撤销,恢复功能(再执行最近一次操作)
1
2
3
4
5
6
7
8
9
10
11
12
13
14
15
16
17
18
19
20
21
22
23
24
25
26
27
28
29
30
31
32
33
34
35
36
37
38
39
40
41
42
43
44
45
46
47
48
49
50
51
52
53
54
55
56
57
58
59
60
61
62
63
64
65
66
67
68
69
70
71
72
73
74
75
76
77
78
79
80
81
82
83
84
85
86
87
88
89
90
91
92
93
94
95
96
97
98
99
100
101
102
103
104
105
106
107
108
109
110
111
112
113
114
115
116
117
118
119
120
121
122
123
124
125
126
127
128
129
130
131
132
133
134
135
136
137
138
139
140
141
142
143
144
145
146
147
148
149
150
151
152
153
154
155
156
157
158
159
160
161
162
163
164
165
166
167
168
169
170
171
172
173
174
175
176
177
178
179
180
181
182
183
184
185
186
187
188
189
190
191
192
193
194
195
196
197
198
199
200
201
202
203
204
205
206
207
208
209
210
211
212
213
214
215
216
217
218
219
220
221
222
223
224
225
226
227
228
229
230
231
232
233
234
235
236
237
238
239
240
241
| function repaint(ctx, strokes) {
ctx.clearRect(0, 0, ctx.canvas.width, ctx.canvas.height);
if (strokes === undefined) {
return false;
}
strokes.map((stroke) => {
const { strokeColor, width, graphType } = stroke;
ctx.strokeStyle = strokeColor;
ctx.lineWidth = width;
const startX = stroke.data[0].x;
const startY = stroke.data[0].y;
const { x, y } = stroke.data[stroke.data.length - 1];
ctx.beginPath();
if (graphType === 'pencil') {
for (let i = 0; i < stroke.data.length; i++) {
const prev = stroke.data[i - 1];
const current = stroke.data[i];
if (prev !== undefined) {
ctx.moveTo(prev.x, prev.y);
}
ctx.lineTo(current.x, current.y);
}
} else if (graphType === 'line') {
ctx.moveTo(startX, startY);
ctx.lineTo(x, y);
} else if (graphType === 'circle') {
ctx.save();
const o1 = (startX + x) / 2;
const o2 = (startY + y) / 2;
const a = Math.abs((x - startX) / 2);
const b = Math.abs((y - startY) / 2);
const r = (a > b) ? a : b;
const ratioX = a / r;
const ratioY = b / r;
ctx.scale(ratioX, ratioY);
ctx.arc(o1 / ratioX, o2 / ratioY, r, 0, 2 * Math.PI, false);
ctx.restore();
} else if (graphType === 'square') {
ctx.moveTo(startX, startY);
ctx.lineTo(x, startY);
ctx.lineTo(x, y);
ctx.lineTo(startX, y);
ctx.lineTo(startX, startY);
} else if (graphType === 'rubber') {
for (let i = 0; i < stroke.data.length; i++) {
const { x, y } = stroke.data[i];
const size = 2;
ctx.strokeStyle = '#000000';
ctx.clearRect(x - size * 10 , y - size * 10 , size * 20 , size * 20);
}
} else if (graphType === 'text') {
ctx.font = "16px Microsoft YaHei";
ctx.fillStyle = strokeColor;
ctx.fillText(stroke.text, startX, startY);
}
ctx.stroke();
ctx.closePath();
});
}
export default class WhiteBoard {
constructor(options) {
this.canvas = document.getElementById('canvas');
this.ctx = this.canvas.getContext('2d');
this.isDrawing = false;
this.strokeColor = '#000';
this.lineWidth = 2;
this.graphType = 'pencil';
this.strokes = [];
this.redo = [];
this.textSite = {};
const { wid, token } = options;
const ws = `ws://live.ngrok.elitemc.cn:8000/ws/whiteboard-${wid}?token=${token}`;
this.socket = new WebSocket(ws);
this.init();
}
init = () => {
const { canvas, ctx } = this;
canvas.onmousedown = (event) => {
this.isDrawing = true;
const x = event.clientX - canvas.getBoundingClientRect().x;
const y = event.clientY - canvas.getBoundingClientRect().y;
if (this.graphType === 'text') {
this.showTextBox(x, y);
} else {
this.addPoint(x, y, true);
}
if (this.graphType === 'rubber') {
this.showRubber(x, y);
}
};
canvas.onmousemove = (event) => {
const x = event.clientX - canvas.getBoundingClientRect().x;
const y = event.clientY - canvas.getBoundingClientRect().y;
if (this.graphType === 'text') {
return false;
}
if (this.isDrawing) {
this.addPoint(x, y);
}
if (this.graphType === 'rubber') {
this.showRubber(x, y);
}
};
canvas.onmouseup = () => {
this.isDrawing = false;
if (this.graphType === 'text') {
return false;
} else {
this.sendStrokes();
}
};
canvas.onmouseleave = () => {
this.isDrawing = false;
if (this.graphType === 'rubber') {
this.ctx.clearRect(0, 0, canvas.width, canvas.height);
this.repaint();
}
};
}
showTextBox = (x, y) => {
const textElem = document.getElementById('text');
textElem.style.display = 'block';
textElem.style.top = y + 'px';
textElem.style.left = x + 'px';
this.textSite = { x, y };
}
showRubber = (x, y) => {
const { ctx } = this;
ctx.lineWidth = 1;
ctx.clearRect(0, 0, canvas.width, canvas.height);
this.repaint();
ctx.beginPath();
ctx.strokeStyle = '#000000';
const size = 2;
ctx.moveTo(x - size * 10 , y - size * 10 );
ctx.lineTo(x + size * 10 , y - size * 10 );
ctx.lineTo(x + size * 10 , y + size * 10 );
ctx.lineTo(x - size * 10 , y + size * 10 );
ctx.lineTo(x - size * 10 , y - size * 10 );
ctx.stroke();
}
sendStrokes = () => {
this.socket.send(JSON.stringify({ kind: 1, points: this.strokes }));
}
addPoint = (x, y, newStroke, str) => {
const p = { x, y };
const { graphType } = this;
if (graphType === 'text') {
const d = { data: [p], text: str, strokeColor: this.strokeColor, graphType: this.graphType };
this.strokes.push(d);
} else if (newStroke) {
const d = { data: [p], strokeColor: this.strokeColor, width: this.lineWidth, graphType: this.graphType };
this.strokes.push(d);
} else if (graphType === 'pencil' || graphType === 'rubber') {
this.strokes[this.strokes.length - 1].data.push(p);
} else if (graphType === 'line' || graphType === 'circle' || graphType === 'square') {
this.strokes[this.strokes.length - 1].data[1] = p;
}
this.repaint();
}
repaint = () => {
repaint(this.ctx, this.strokes);
}
setLineWidth = (width) => {
this.lineWidth = width;
}
setGraphType = (graphType) => {
this.graphType = graphType;
}
setGraphColor = (color) => {
this.strokeColor = color;
}
clear = () => {
this.strokes = [];
this.ctx.clearRect(0, 0, canvas.width, canvas.height);
this.sendStrokes();
}
cancelOneStep = () => {
if (this.strokes.length > 0) {
this.redo.push(this.strokes[this.strokes.length - 1]);
this.strokes.pop();
this.repaint();
this.sendStrokes();
}
}
redoStep = () => {
if (this.redo.length > 0) {
this.strokes.push(this.redo[this.redo.length - 1]);
this.redo.pop();
this.repaint();
this.sendStrokes();
}
}
}
export class ClientBoard {
constructor(options) {
this.canvas = document.getElementById('canvas');
this.ctx = this.canvas.getContext('2d');
const { wid, token } = options;
const ws = `ws://live.ngrok.elitemc.cn:8000/ws/whiteboard-${wid}?token=${token}`;
this.socket = new WebSocket(ws);
this.socket.onmessage = (event) => {
const messages = event.data.split('\n');
messages.map((data) => {
this.onMessage(JSON.parse(data));
})
}
this.socket.onopen = (event) => {
}
}
onMessage = (message) => {
repaint(this.ctx, message.points);
}
}
|